by Katy Robinson | Jul 7, 2026 | FQHCs
Health centers that have invested in financial structure hold an asset many of them undervalue. The documented controls, consistent processes, and reliable reporting built for compliance form exactly the foundation that strategic growth requires. The data is trustworthy. The processes are repeatable. The visibility exists. What remains is pointing all of it at a new set of questions.
The Questions Change, the Discipline Stays
Compliance asks: are funds tracked, controlled, and reported correctly? Strategy asks: where should the next dollar go? Both questions run on the same infrastructure. A health center that can demonstrate control over federal funds can, with the same data, evaluate which service lines deserve expansion, what a new access point would require, and how much growth the organization can absorb without straining its operations.
This is the dividend of integrated financial and operational insight: once encounters, payer behavior, and cash flow connect to financial reporting, leadership holds a decision-making engine, ready for questions far beyond oversight.
What a Strategic Financial Plan Includes
A strategic financial plan for an FQHC connects mission priorities to financial capacity over a multi-year horizon. The strongest plans share four elements:
- A capacity baseline: current margins by service line and site, cash flow patterns across the year, reserve levels, and the organization’s realistic bandwidth for change.
- Growth scenarios with financial models attached: each strategic option, a new service, a new site, extended hours, expressed in projected encounters, staffing, revenue, and investment required.
- A funding map: how operational cash, grants, and financing each contribute to the plan, with timing aligned to the organization’s reporting and filing cycles.
- Decision triggers: the specific indicators that tell leadership when to accelerate, pause, or adjust.
Scenario modeling works best when it starts from operational reality. Budgets and forecasts built through operational integration already incorporate encounter volumes, payer distribution, and utilization trends, the same inputs every growth scenario depends on.
Mid-Year: The Natural Planning Window
Timing matters. Mid-year sits at a uniquely useful point in the FQHC calendar: far enough into the year that current trends are real, early enough that next year’s budget remains open. The Q1 close has settled, regulatory filing cycles have produced a fresh, validated picture of the prior year, and leadership can plan from confirmed data rather than projections alone.
Health centers that anchor strategic planning to this window give themselves two advantages: the plan informs the next budget instead of arriving after it, and every scenario is built on numbers that have already survived review.
The Infrastructure Pays Twice
There’s a satisfying symmetry in this pivot. The automation and standardized workflows that made compliance sustainable also make planning fast, scenarios that once took weeks of spreadsheet work now take days. The transparency that strengthened internal accountability now equips department leaders to contribute realistic inputs to the plan. Every investment made for control returns a second time as strategic speed.
At Lavoie CPA, we help FQHCs make this pivot deliberately, building strategic financial plans on the compliance foundation they already own, with scenarios modeled from real operational data and a clear map from mission priorities to financial decisions.
Start the conversation today.
by Katy Robinson | Jul 7, 2026 | SaaS
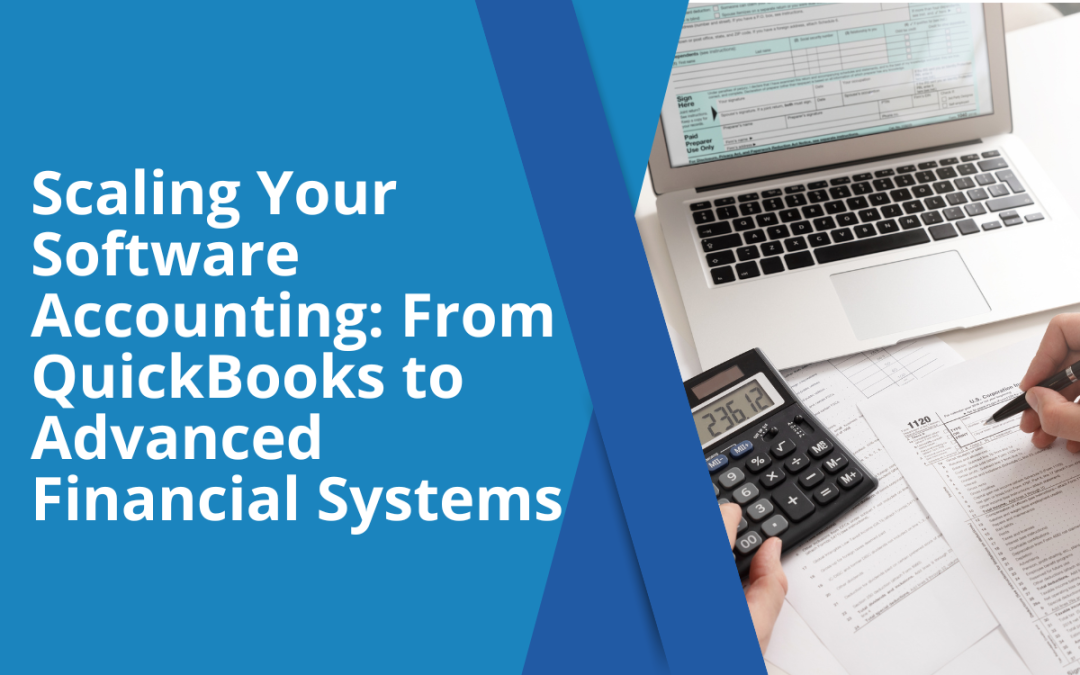
How Growing Software Companies Build the Financial Infrastructure That Keeps Pace With Their Success
The Growth That Calls for a Better Back Office
Your software company is winning contracts faster than ever. Revenue recognition requires contract-by-contract analysis. Implementation costs need deferral assessments. Commission accounting requires judgment on every deal. The pipeline is strong, and your accounting team is ready to support what comes next.
This is exactly the moment to invest in the systems and processes that make scaling sustainable. Growing software companies that build accounting infrastructure ahead of the curve gain something powerful: the ability to close faster, report with confidence, and give leadership the financial visibility it needs to keep making bold decisions.
Upgrading systems is now a requirement, and it is critical to set them up in a way that sets the business up for the next phase of growth.
Five Areas Where Better Systems Create the Most Value
Through our work with software companies at this inflection point, five operational areas consistently offer the greatest opportunity for improvement:
1. Month-End Close Speed and Accuracy
As contract volume grows, close procedures built on documented processes and integrated systems outperform those built on manual data pulls and individual knowledge. A close process designed for scale, one that leverages automation and clear ownership, produces faster, more reliable results and gives leadership timely numbers to act on.
2. Cross-Departmental Visibility
When project management, sales, and accounting share real-time data through connected systems, the accounting team works from complete, current information. Revenue classification, contract amendments, and delivery milestones are visible when they happen, not days later. That visibility translates directly into faster decisions and more accurate reporting.
3. Revenue Recognition Documentation
ASC 606 requires entities to make significant judgments and document them, complex vs. non-complex classification, standalone selling price estimation, materiality assessments, and variable consideration constraints. When documentation is built into the contract onboarding process from day one, it becomes a strength rather than a burden. Companies that systematize this early build an audit-ready position as a matter of course.
4. System Integration
Growing software companies often run a combination of tools: a general ledger, project management software, CRM, and reporting utilities. When these systems communicate through APIs and automated data flows, the accounting team shifts its focus from data movement to financial analysis. That’s where the real value lies.
5. Role Clarity and Team Structure
As contract complexity grows, defining who owns revenue recognition decisions, who documents contract classifications, and who interfaces with project management creates the kind of accountability that scales. Clear roles mean nothing falls through the cracks, and every team member knows exactly where they add value.
The System Roadmap
The most successful transitions follow a phased approach, building deliberately rather than replacing everything at once:
Phase 1: Document Current State
Before selecting new systems, map what exists. Document current close procedures, identify where automation would create the most leverage, and catalog the systems currently in use. This creates a specification document that drives intelligent, targeted system selection.
Phase 2: Evaluate and Select Systems
Appoint a project leader. Write specifications that include must-haves, nice-to-haves, and preferences. Request demonstrations from qualifying providers and ensure all key users participate. Prioritize systems that communicate through APIs rather than manual uploads.
For software companies, the ecosystem typically includes a more advanced financial system (Sage Intacct is a common choice at this stage), integrated expense management (Ramp, Divvy), accounts payable automation (Bill.com), and project management tools that feed data directly to the accounting system.
Phase 3: Implement With Controls
Implementation should follow documented procedures with clear accountability. The goal is to connect front-end operational systems seamlessly with backend accounting systems, so data flows automatically and the accounting team is free to focus on judgment and analysis.
Phase 4: Build Sustainable Processes
New systems deliver their full value when paired with strong processes. Revenue recognition templates populated at contract signing, standard documentation workflows for ASC 606 judgments, and clear communication protocols between project management and accounting make the upgrade durable, not just functional.
Seeing It in Action
A software company with a growing SaaS contract portfolio was ready to move beyond QuickBooks and manual Excel reconciliations. The team recognized that the tools that had served them well in the early stages were ready to be replaced by something built for scale.
The assessment identified the highest-value opportunities: automating the close process, connecting project management and accounting systems, and embedding ASC 606 documentation into the contract onboarding workflow.
The recommended approach: invest in integrated project management and advanced financial systems, establish real-time communication protocols between departments, and build automated data flows to replace manual transfers.
The outcome: faster close cycles, stronger financial visibility, and an accounting infrastructure ready to support the next wave of contract growth, without additional friction.
Building for What’s Next
Every growing software company reaches the point where its accounting infrastructure needs to evolve. The companies that move proactively, building systems and processes ahead of demand, gain a meaningful advantage: they close faster, report with more confidence, and give their leadership teams better information at every stage.
Moving to advanced financial systems is not about adding complexity. It is about building infrastructure that automates the routine, eliminates manual bottlenecks, and frees your team to focus on the judgments that drive value, revenue classification, cost capitalization, and the documentation that supports both.
At Lavoie CPA, we work with software and SaaS companies at the inflection point between startup accounting and advanced financial systems, and we help them make that transition with clarity, precision, and confidence.
Start the conversation today.
by Katy Robinson | Jul 1, 2026 | SaaS
Matching Commissions with the Revenues They Generate
Fundamentals of Incremental Costs for Software Companies
Your sales team closes a three-year SaaS deal worth $1.5 million. The channel partner who sourced the deal earns a 15% commission on the contract value that is paid when the contract closes.
That $225,000 commission often creates a mismatch: a deal that will generate revenue across 36 months is being charged its full acquisition cost in a single period.
Under ASC 340-40, that commission is an incremental cost of obtaining a contract. When the amortization period exceeds one year, capitalizing and amortizing it over the life of the benefit brings your cost recognition into alignment with the revenue it helped generate, and gives your margin profile a far more accurate picture of deal economics.
What Qualifies as an Incremental Cost
ASC 340-40 defines incremental costs of obtaining a contract as costs that an entity would not have incurred if the contract had not been obtained. The most common example: sales commissions paid to internal sales representatives or external channel partners.
The key word is incremental. Costs incurred regardless of whether the contract was obtained, base salaries, general marketing expenses, administrative overhead, are period expenses. Commissions that are contingent on winning a specific contract, whether paid to internal employees or external partners, meet the definition of incremental costs and are evaluated for capitalization and amortization.
Capitalize or Expense: The Decision Framework
Once you identify an incremental cost, the next question is how to treat it. The answer depends on the expected amortization period:
Capitalize and amortize when the expected period of benefit exceeds one year. The commission is recorded as a contract asset and amortized over the period during which the entity expects to transfer goods or services related to the cost.
Expense as incurred when the expected period of benefit is one year or less. ASC 340-40 provides a practical expedient for these shorter-duration costs.
For multi-year SaaS contracts, commissions almost always exceed the one-year threshold. Capitalization is required, and when handled well, it produces a more understandable margin story across every period of the contract.
Getting the Amortization Period Right
The amortization period is not automatically the contract term. It is the period during which the entity expects to benefit from the cost, and that distinction requires precision.
Consider a commission structure where the channel partner earns 15% on the initial contract but only 5% on renewals. Because the company expects renewals at a lower commission rate, the initial commission benefits the entity beyond the initial contract term. The amortization period should reflect this extended benefit period, smoothing the cost recognition across a longer horizon.
Conversely, if renewal commissions are commensurate with initial commissions, meaning the partner earns the same rate on renewals, the initial commission is amortized over the initial contract term only.
Getting this right produces an expense pattern that moves in step with the value the commission actually delivered.
Channel Partners and Third-Party Commissions
Software companies frequently sell through channel partners, value-added resellers, or procurement intermediaries. When the software company is the principal in the arrangement, controlling the software before it is transferred to the end customer, revenue is recorded on a gross basis.
The commission paid to the channel partner is then an incremental cost of obtaining the contract, subject to the same capitalize-and-amortize framework.
This is where capitalization delivers one of its clearest benefits: gross revenue is recognized over the contract term, and the related commission is amortized alongside it. The result is a margin profile that accurately reflects the economics of the deal across all periods, rather than compressing acquisition costs into a single month while the revenue spreads across years.
Variable Consideration and Commissions
Some contracts include provisions that create variable commission structures. Performance guarantees, subcontractor utilization requirements, or liquidated damages clauses can affect total consideration and, by extension, the commission base.
These provisions require judgment. If the company must concede a portion of revenue due to a contractual shortfall, both the revenue and the related commission asset are affected. The commission capitalization should reflect the amount the entity expects to actually earn, consistent with the variable consideration constraint applied to revenue recognition.
Seeing It in Action
A software company wins a SaaS contract through a channel partner. The company is the principal software provider and records revenue on a gross basis. The channel partner earns a commission for sourcing the deal.
Because the contract term exceeds one year and the commission would not have been incurred without the contract, the company capitalizes it as an incremental cost of obtaining the contract. The commission is amortized over the contract term, aligned with the pattern of revenue recognition.
The contract also requires the company to meet certain performance and utilization thresholds. Management evaluates any revenue concessions as variable consideration, constraining the estimate accordingly, and aligning the commission asset with the revenue it supports.
The Opportunity in Your Commission Accounting
Sales commissions in software are more than a line item on the income statement. Treated as the balance sheet assets they often are, they become a tool for aligning cost and revenue recognition, producing margin profiles that reflect the true economics of multi-year contracts, and giving leadership, and investors, a financial story they can rely on.
The companies that capitalize commissions on multi-year contracts, amortize them over the appropriate benefit period, and document their methodology consistently are the ones whose financials hold up under scrutiny and tell a confident story about deal profitability.
At Lavoie CPA, we work with software and SaaS companies ready to bring that kind of clarity and precision to their commission accounting.
Start the conversation today.
by Katy Robinson | Jul 1, 2026 | SaaS
How Deferring and Amortizing Development Costs Impacts a Software Company’s Financial Statements
Capitalized Contract Costs
Your engineering team just spent $110,000 with a third-party development partner building features for a new SaaS contract. The features are specific to this customer’s requirements, but they also create capabilities that will serve future contracts on the same platform.
Under ASC 340-40 and ASC 606, those same costs are likely required to be recorded on your balance sheet as contract assets, deferred and amortized over the life of the contract they support.
How Incremental Costs Should be Recorded
Subtopic 340-40 establishes the accounting for incremental costs of obtaining a contract and costs to fulfill a contract. For software companies, when revenues are recognized over a period of time, the accompanying contract costs are expensed over the same period of time.
Costs to fulfill a contract are capitalized as contract assets when three conditions are met:
- The costs relate directly to a contract or anticipated contract.
- The costs generate or enhance resources that will be used to satisfy performance obligations in the future.
- The costs are expected to be recovered through the contract.
When all three conditions are met, the costs are deferred and amortized on a systematic basis consistent with the pattern of revenue recognition for the related performance obligations. The result is an income statement and balance sheet that move in sync with the contracts that drive your business.
Contract Assets vs. Internally Developed Software
Software companies face a meaningful classification determination: should pre-go-live development costs be capitalized as contract assets under ASC 340-40, or as internally developed software under ASC 350-40?
The distinction matters because amortization periods and methods may differ. Contract assets are generally amortized over the contract term. Internally developed software is amortized over its estimated useful life.
When the features being developed serve a specific contract, and future applicability to other contracts is not yet discernible, classification as contract assets is appropriate. The costs are directly linked to a specific arrangement and are recovered through that arrangement’s revenue.
When the development creates features with clear, identifiable applicability to future customers beyond the current one, classification as internally developed software may be more appropriate.
Getting the Amortization Period Right
Contract assets are amortized over the period during which the entity expects to transfer the related goods or services. For SaaS arrangements, this is typically the contract term, including expected renewal periods if renewals are reasonably certain.
The amortization period requires judgment. Consistent application across similar contracts is also generally required.
After the go-live date has gone live. Post-go-live operational costs, maintenance, bug fixes, minor enhancements, are expensed as incurred. Tracking and documenting this transition clearly is what gives finance teams confidence in the position.
Subcontractor Development Costs
Third-party development costs, payments to development partners for building platform features, follow the same framework. If the development partner is building features that meet the three capitalization criteria for contractual costs, those costs should be recorded on the balance sheet and amortized over the contract life.
Seeing It in Action
A software company contracts a third-party development partner for $110,000 to build features for its proprietary platform. The features are developed specifically for a SaaS contract with a five-year term.
Management evaluates whether the development creates capabilities applicable to future contracts. The features are specific enough that future applicability is not discernible at the time of development. Management classifies the costs as contract assets because they relate directly to the current contract and will be recovered through its revenue.
The $110,000 is deferred and amortized over the five-year contract term beginning at the go-live date. The income statement reflects approximately $22,000 per year rather than a single-period $110,000 charge.
At Lavoie CPA, we work with software and SaaS companies ready to make that story as accurate as it can be.
Start the conversation today.